Your latest Google ad has been carefully crafted and finally published online. However, that doesn’t mean you can sit back and forget about it. Every pay-per-click (PPC) ad you put out needs to have value, and be worth your time and money. Being able to decode and analyse your Google ad is crucial to making sure your efforts are worth it and working to best serve your business.
What are the best key performance indicators for Google Ads?
Key performance indicators (KPIs) are metrics and measurements that businesses use to understand the success of their ad campaigns, and in this case specifically to Google Ads. Google Ads provides metrics such as:
Impressions: The number of times your ad is shown to users.
Clicks: The number of times users click on your ad.
Click-through rate (CTR): The percentage of users who see your ad and then click on it.
Cost per click (CPC): The average amount you paid when someone has clicked on your ad.
Conversions: The number of users who take a desired action after clicking on your ad, such as making a purchase or signing up for your mailing list.
Conversion rate: The percentage of users who click on your ad and then take a converting action.
Cost per conversion: The average amount you pay when someone converts after clicking on your ad.
Return on ad spend (ROAS): The amount of revenue you generate for every dollar you spend in Google Ads.
To find all of these metrics, sign into your Google Ads account and click on the reports tab in the left-hand menu. There are many reports you can access from there, for example, if you want to view conversion rate data, you could select the Conversions report.
To tailor the data in the reports to your liking, you can also create custom reports to track specific metrics and KPIs. To do this, click on the custom reports tab in the left-hand menu and then click on the ‘create new report’ button. Once you have selected the report that you want to view, you can customise the report by actions such as adding or removing columns and filtering data accordingly.
Analyse Google Ads in Google Analytics (GA4)
Google Ads provides a great array of metrics and KPI’s to analyse your ads with ease directly from its own platform, however if you want to take things one step further, you may want to consider using Google Analytics to gain more insights on your campaign and website performance.
So let’s start looking at how you connect Google Ads and Google Analytics:
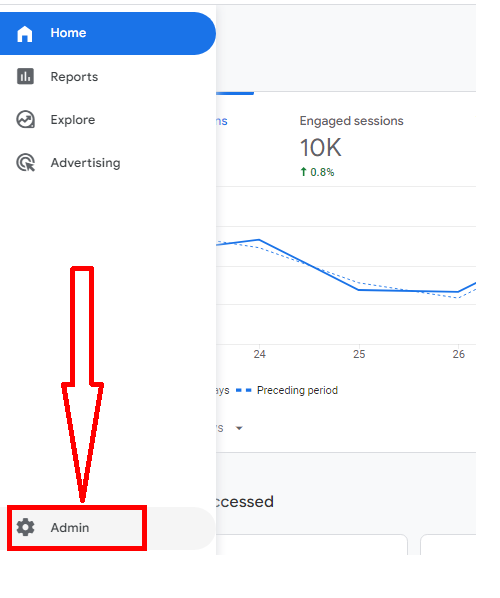
Sign in to your Google Analytics account.
Click on the Admin tab in the left-hand menu.
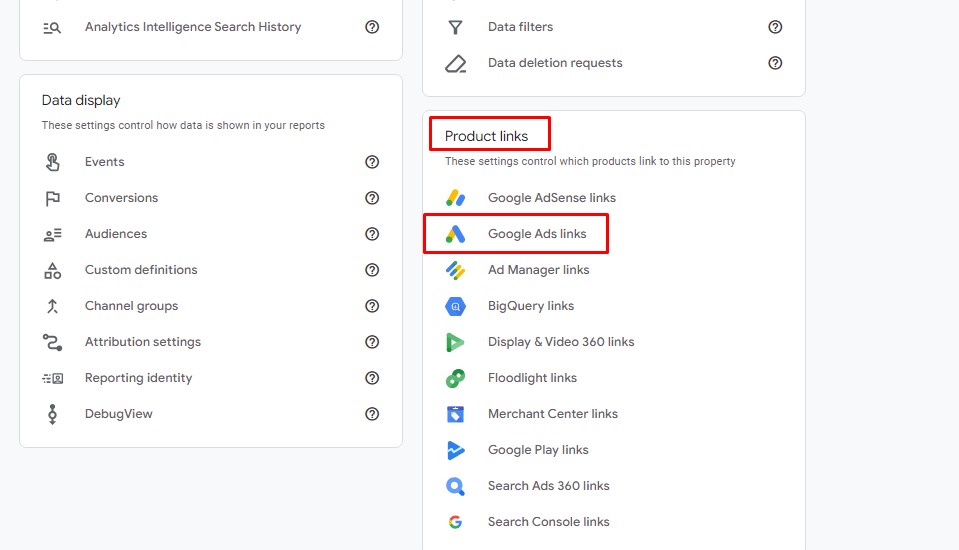
Next, find the Product Links → Google Ads Links in the property column and click on it.
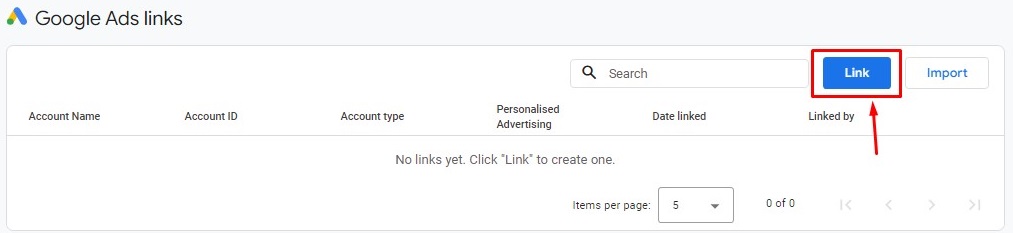
Click on the Link accounts button.
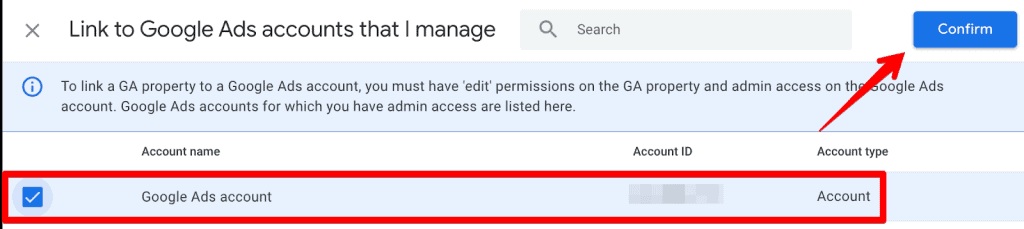
Enter your Google Ads account ID and click on the button to proceed.
Once your accounts are linked, you will be able to see data from your Google Ads campaigns in Google Analytics. To view this data, go to the Acquisition report in Google Analytics and then click on the Google Ads tab. This will allow you to analyse your Google Ad campaigns through a variety of reports.
Some tips for this analysis are to:
Use the filters in Google Analytics to narrow down the data. For example, you can filter the data by date range, campaign, ad group, ad, and keyword.
Use the segments in Google Analytics to create different views of your data. For example, you can create segments for different types of visitors, such as new visitors and returning visitors.
Use the goals in Google Analytics to track conversions that you want visitors to take on your website. For example, you can create goals for conversions such as making a purchase or signing up for your newsletter.
Use the funnels in Google Analytics to track the steps that visitors take on your website before completing a goal. This information can help you to identify areas where you can improve the user experience and increase conversions.
Some other website KPI’s you can find include:
Visitors: The number of unique people who visit your website or app.
Page views: The total number of pages that are viewed on your website or app.
Sessions: The total number of visits to your website or app.
Bounce rate: The percentage of visitors who leave your website or app after viewing only one page.
Average session duration: The average amount of time that visitors spend on your website or app.
Google Analytics is a great tool to have alongside your Google Ads for effective campaign creation.
Setting up and monitoring conversion tracking
Google Ads conversion tracking allows you to see how effectively your ad clicks lead to an action taken (a conversion). This can include website purchases, phone calls, app downloads, or newsletter sign-ups.
To set it up, you have to:
Sign in to your Google Ads account.
Click the Tools & Settings icon in the top right corner of the page.
Click the Conversions tab.
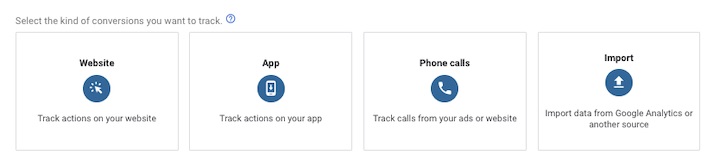
Click the + button and select website, app, or phone.
Answer the relevant questions for whichever of the platforms you have chosen
Enter a name for your conversion action and select the type of action.
Click the Continue button.
On the next page, you can choose to create a conversion tag or use an existing tag.
If you’re creating a new tag, click the Create tag button and follow the instructions to create your tag.
Once you have created your tag, you will need to install it on your website or app.
Click the Finish button to save your conversion action.
If you want to track multiple conversions, set up a different conversion tag/action for each type of conversion you want to track. For example, if you want to track purchases and also track phone calls you receive.
Measuring your ROI
Return on investment (ROI) refers to the ratio of your net profit to your costs. It allows you to see how much profit you are reaping on your advertising efforts.
Once you’ve started to measure conversions, you can begin evaluating your ROI. The value of each conversion should be greater than the amount you spent to get that conversion.
To calculate ROI, take the revenue that resulted from your ads, subtract your overall costs, then divide by your overall costs: The formula should look like this:
ROI = (Marketing revenue – Marketing costs) / Marketing costs
This is important to gauge the financial value of your marketing efforts and see whether you are making profit or losses.
Gain Better Campaign Performance Insights
Decoding your Google Ads is important to monitor your successes and missteps. Using Google Ads, Analytics, implementing conversion tracking, and measuring the effective ROI of your campaigns, these are all steps you can undertake to improve your Google Ads performance starting today.
With over 20 years experience in online marketing, Andrea started his career client side working in the travel industry in Italy first, and then in London. After moving to Steak Digital he started his long spell working for some of the best agencies, including OMD International and iCrossing where he managed global accounts for brands like PlayStation, Virgin and Infiniti. In 2011 he moved to Australia to join AtomicSearch as Head of Search. where in 5 years he filled in many roles and responsibilities and has had the opportunity to work with local brands like AMP, Interflora, NIB, but also Nike Australia and Origin Energy, until in 2016 he became General Manager of the Sydney team at iProspect. Since 2017 he is the co-founder of Search Tribe and Ambire.